Really Cool Graphs
As you probably know, there are a ridiculously huge amount of cool graphs out there. Of course, I can only discover so many of them, but this is a page of really cool graphs that I have found. All of these pictures have been rendered by an extremely old version of a quite excellent program called Nucalc (aka Graphing Calculator). I think it often does a better job of function rendering than Mathematica, but don't tell anyone. Anyway, these are only 390x390 chunks of the graph. If you want larger pictures, just ask me!
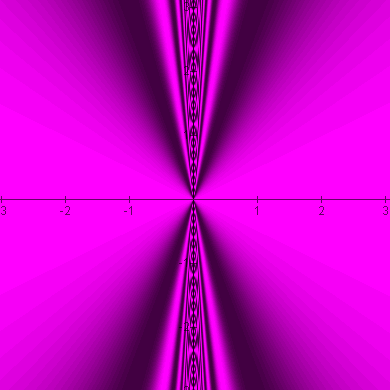
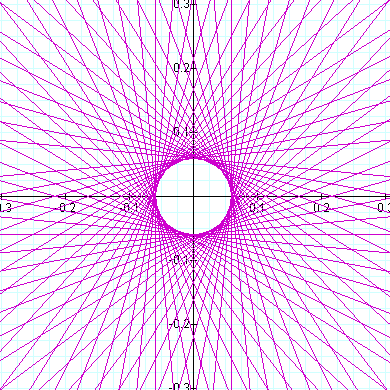
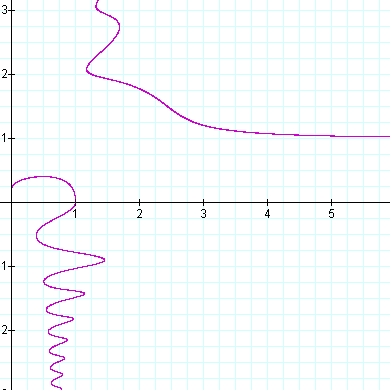
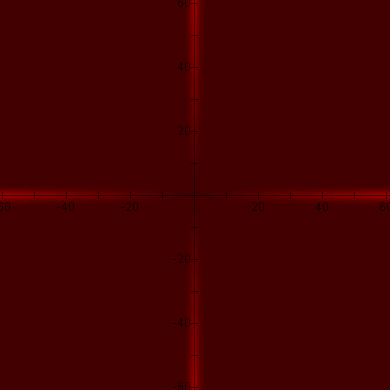 ArcSech(x) + ArcSech(y) | 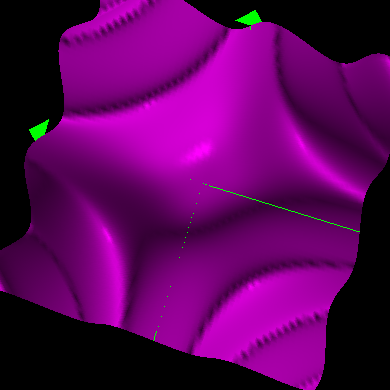 z = ArcSin(xy) |
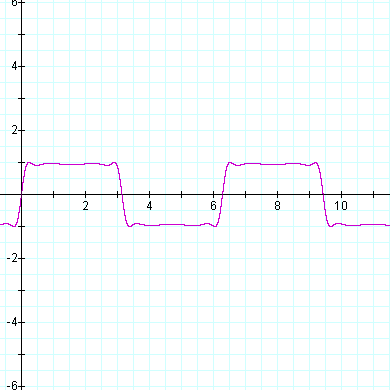
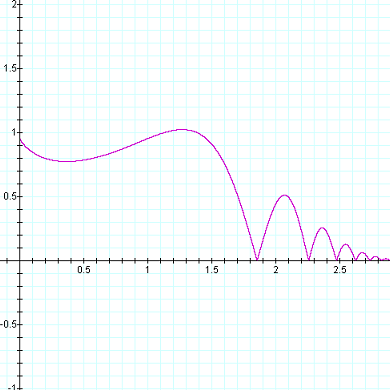 y = |Sin(xx)/2(xx-pi/2)/pi| |
 x2y2z2 = 1 |
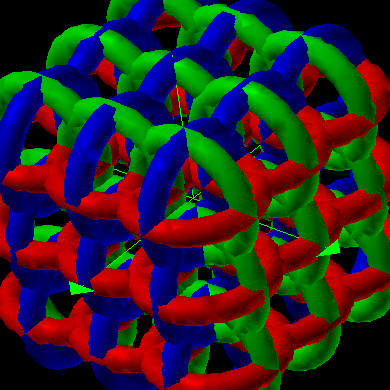
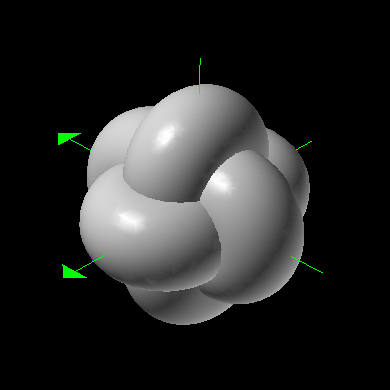
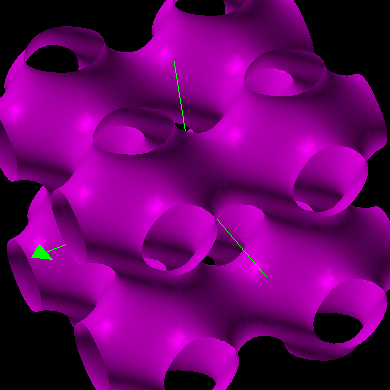 Cos2(x) + Cos2(y) + Cos2 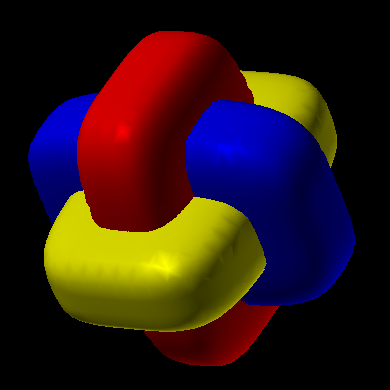 (3x/2)4 + (3x)4 + z4 = 1 (3x)4 + y4 + (3z/2)4 = 1 x4 + (3y/2)4 + (3z)4 = 1 | |
 r = Cos(26 t); theta = 26 Sin(26 t) |
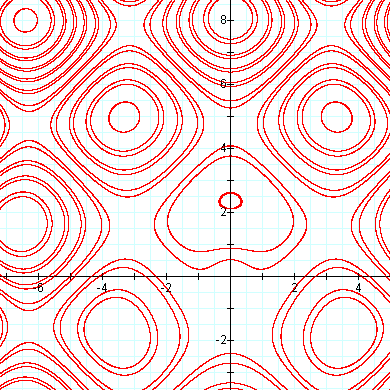
 Cos(x) + Cos(y) + Cos(z) + Sin(x) + Sin(y) + Sin(z) = 2.2 |
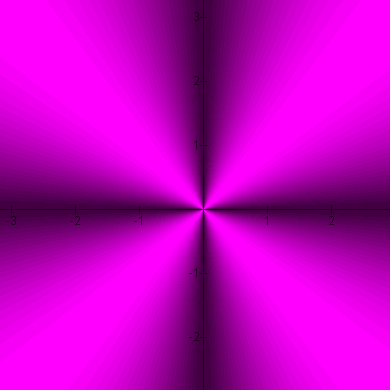
 Sin(Cos(Tan(theta))) |
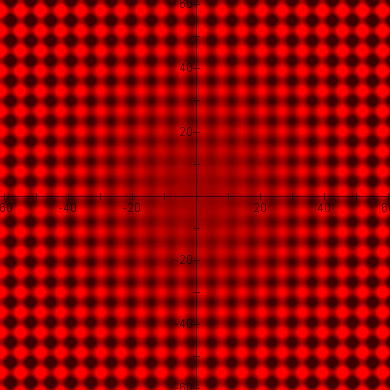
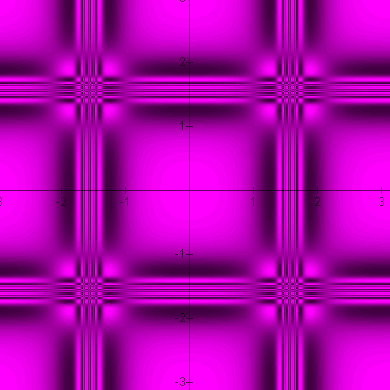 Sin(Cos(Tan(x))) * Sin(Cos(Tan(y))) |
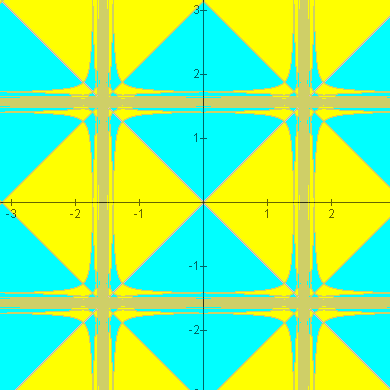 Sin(Cos(Tan(x))) > Sin(Cos(Tan(y))) Sin(Cos(Tan(x))) = Sin(Cos(Tan(y))) Sin(Cos(Tan(x))) < Sin(Cos(Tan(y))) |
 Sin(2 Sin(2 Sin(2 Sin(x)))) |
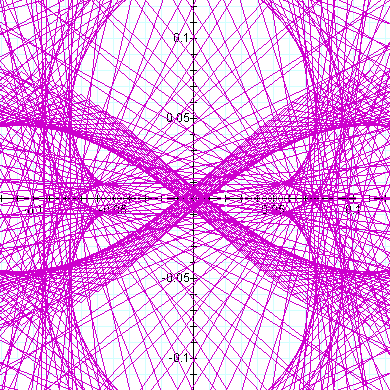
 r = Tan(17 theta) + Cot(17 theta) |
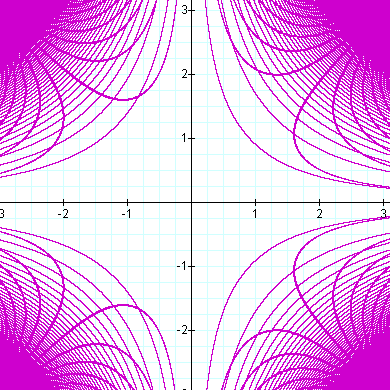
 ArcSin(x) + ArcSin(y) |
 (lots of equations) |
 Sin(y2 x3) = Cos(y3 x2) |
 r = xy - Sin(theta y2) |
 Tan(ArcCos(x) + ArcSin(y)) = 1 |
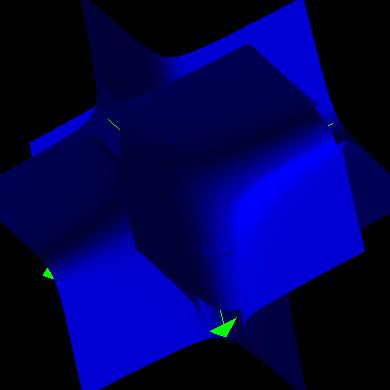
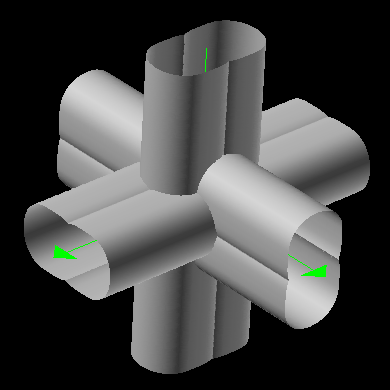 (Sqrt((|z| - 13)2 + z2) - 9)2 + x2 = 100 (Sqrt((|x| - 13)2 + x2) - 9)2 + y2 = 100 (Sqrt((|y| - 13)2 + y2) - 9)2 + z2 = 100 |
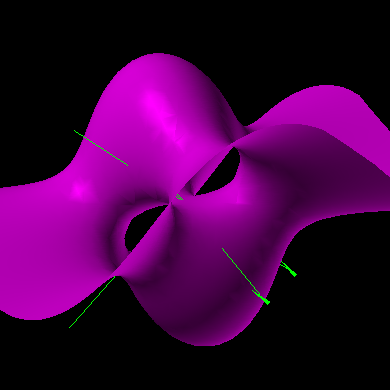 x3 + y3 + z3 = x + y + z |
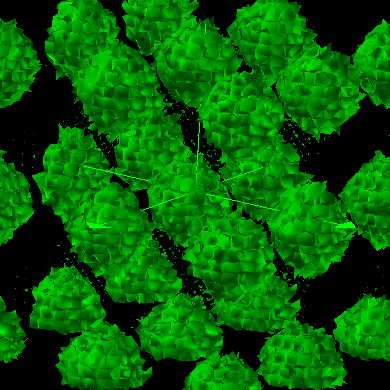
 (Sqrt((|z| - 13)2 + y2) - 9)2 + x2 = 100 (Sqrt((|x| - 13)2 + z2) - 9)2 + y2 = 100 (Sqrt((|y| - 13)2 + x2) - 9)2 + z2 = 100 |
 |(Sin(theta + pi) Cos(theta + pi))/pi| |